Key Findings: From the 2022-2023 Compensation Report

The Apartment Association of Metro Denver has conducted an industry compensation study every other year since 1999. Compensation data was collected from 32 different management companies, and included specific data for 3,354 individual people who work in the Metro Denver apartment industry. The study included 569 different apartment communities, and 149,116 apartment units, which is 39% of the entire metro Denver apartment inventory. The average community size was 263 units. Most of the management companies would be considered medium to large size, but there were some small management companies included in the data. There were over 54,000 pieces of data imputed into the survey and the final report will be available soon. The report is available for sale for $599 at www.aamdhq.org Here are some key findings:
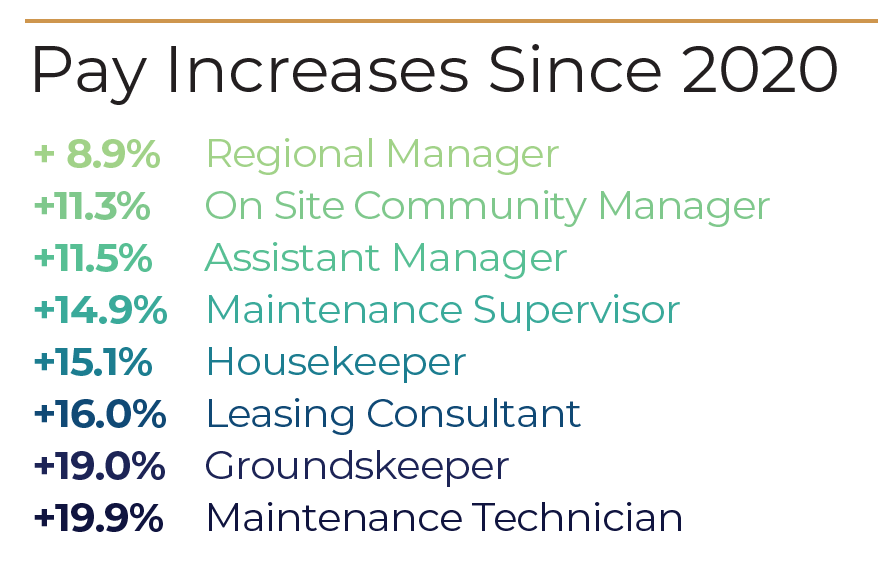
Compensation Increased 15.6% In Two Years
In this year’s study, we found that there was an overall increase in compensation of 15.6% since the last time we collected data two years ago. Annualized this would equate to 7.8% increase per year. The increases ranged between 8.9% to 19.9% depending on the position.
Maintenance Positions Increased the Most
Of all of the industry positions surveyed, the Maintenance positions increased the most over the past 24 months. Maintenance Technician positions increased 19.9%, while Maintenance Supervisors increased 14.9% over the past 2 years.
$1,320 Per Apartment Home
Overall, the data showed that an average community requires an On Site Team average compensation of $1,320 Per Apartment Unit. This figure does not include any burden, taxes or benefits. This calculation also does not consider other positions like accounting, human resources, and other corporate office team member positions, but as you budget for 2023 it’s a slick figure to plug in and compare how your onsite compensation stacks up on a per unit basis.
A fun fact we decided to calculate— To manage and maintain the entire Denver Metro industry’s 390,000 units, it takes approximately $515,000,000 of on-site compensation per year (again this doesn’t include insurance, taxes, etc). If we included Regionals and Executives the figure is over $600,000,000 (again this figure does not include other necessary corporate
office staff like accounting, human resources etc. The annual rent revenue for Denver Metro area apartments is $8.7 Billion.
Regional Manager Portfolio
The average Regional Manger portfolio for the study included 1,580 units, which was typically 6 communities with 33 onsite team members. A Regional Manger on average has been in their position for 5 years. On average a Regional Manger compensation is made up of 85% base salary and 15% incentive pay.
The average VP portfolio includes 5,774 units and 22 communities with 139 onsite team members. On average a Vice President has been in their position for 10 years. On average a VP’s compensation package is made up of 80% base salary and 20% incentive pay.
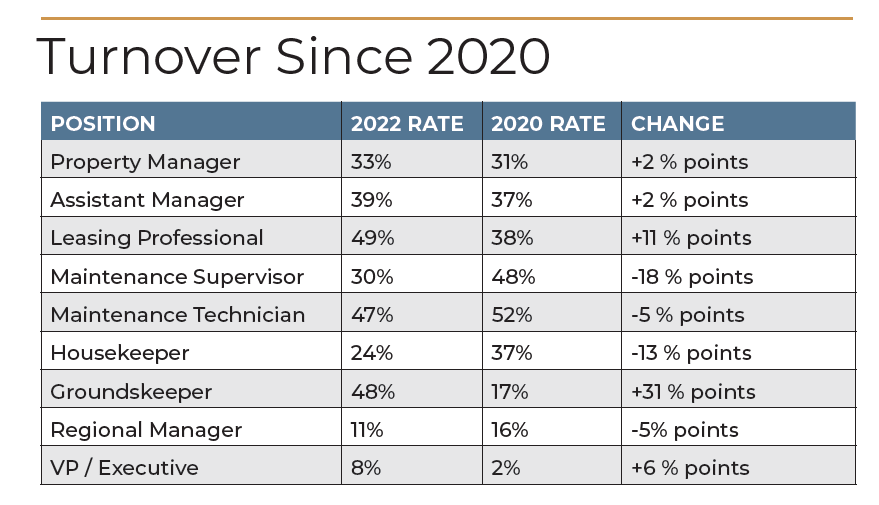
Turnover a Major Problem
Turnover continues to be a problem for our industry, with 38% of the positions turning over in the past 12 months. The highest turnover was at the Leasing positions at 49%. The Maintenance Technician turnover was 47% over the past 12 months. The good news is the Maintenance Tech turnover is down compared to 2 years ago when it was 52%. Even better news is the Maintenance Supervisor turnover went from 48% in 2020 to 30% in 2022. On Site Community Manager turnover was 33% (up 2% from 2020). Regional Manger turnover was 11%, which is down from 16% in 2020.
Base Pay vs. Incentive Pay
Here is a breakdown of how each position’s base salary compares to that positions’s “incentive” pay, which includes bonuses, commissions, annual incentives and apartment allowances in some cases…
- Managers: 85% of comp from BASE PAY, vs 15% incentives & other
- Assistant Managers: – 85% BASE, 15% incentive & other
- Leasing Positions: 79% BASE, 21% incentive & other
- Groundskeeper: 92% BASE, 8% incentive & other
- Housekeeper: 91% BASE, 9% incentive & other
- Maintenance Technician: 91% BASE, 9% incentive & other
- Maintenance Supervisors: 89% BASE, 11% incentive & other
- Maintenance Director: 88% BASE, 12% incentive & other
- Regional Manager: 85% BASE, 15% incentive & other
- VP/Exec: 80% BASE, 20% incentive & other
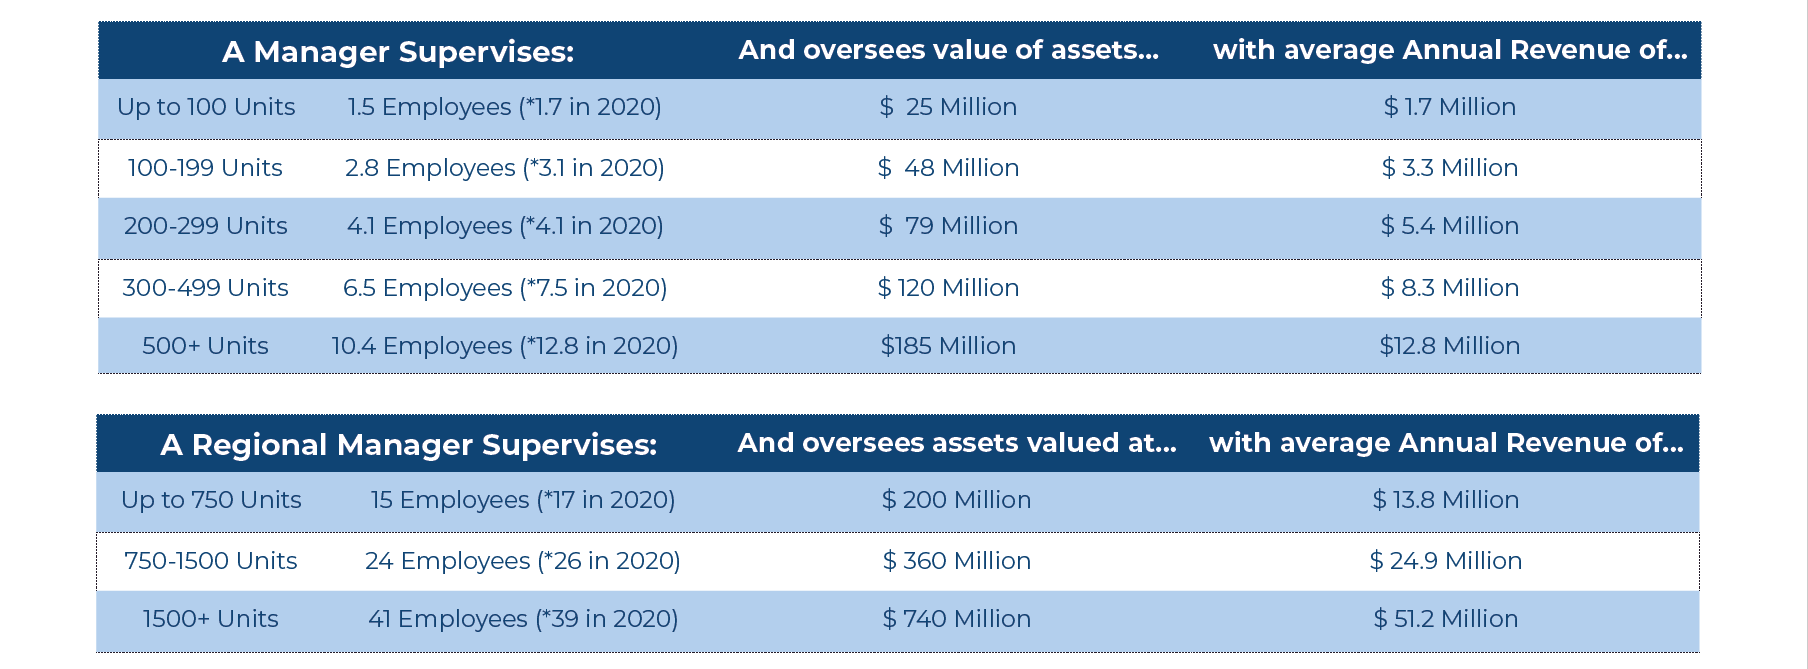
Doing More with Less
What a Manager or Regional Manager gets compensated is rarely compared to what the value of the assets they manage. We’ve taken the time to illustrate just how much in value a manager is overseeing in terms of dollars and just how few of people are on-site operating these properties. Here we’ve broken down how many people a Manager and Regional Manager oversee (compared with 2 years ago). Further, the illustration below shows how much in valued assets that manager or Regional Manager is overseeing. These statistics are broken down by the same (Unit Count) categories that the report illustrates with compensation categories.
AAMD would like to thank the participating companies for confidentially sharing their compensation data. We encourage any feedback or comments. For additional information, questions, or feedback please contact Mark Williams, Executive Vice President for the Apartment Association of Metro Denver. mwilliams@aamdhq.org.